What a Koch chart estimates
A Koch chart is a pilot-training nomogram that relates pressure altitude and temperature to approximate changes in takeoff distance and rate of climb. ClimbCheck’s Legacy Koch option turns that historical line-drawing method into a digital comparison while keeping the inputs visible and editable.
How the original Koch chart works
The traditional chart uses three groups of scales. Airport temperature appears on the left, pressure altitude appears on the right, and the two center scales show the approximate increase in takeoff distance and decrease in rate of climb.
- Find the airport temperature. Use the left scale in degrees Fahrenheit.
- Find pressure altitude. Use the right scale in thousands of feet. Pressure altitude is the altitude indicated when the altimeter is set to 29.92 inHg.
- Connect the two values. Draw a straight line from the temperature point to the pressure-altitude point.
- Read the center scales. Where the line crosses the center, read the approximate percentage increase in takeoff distance and percentage decrease in rate of climb.
How ClimbCheck digitizes the Koch concept
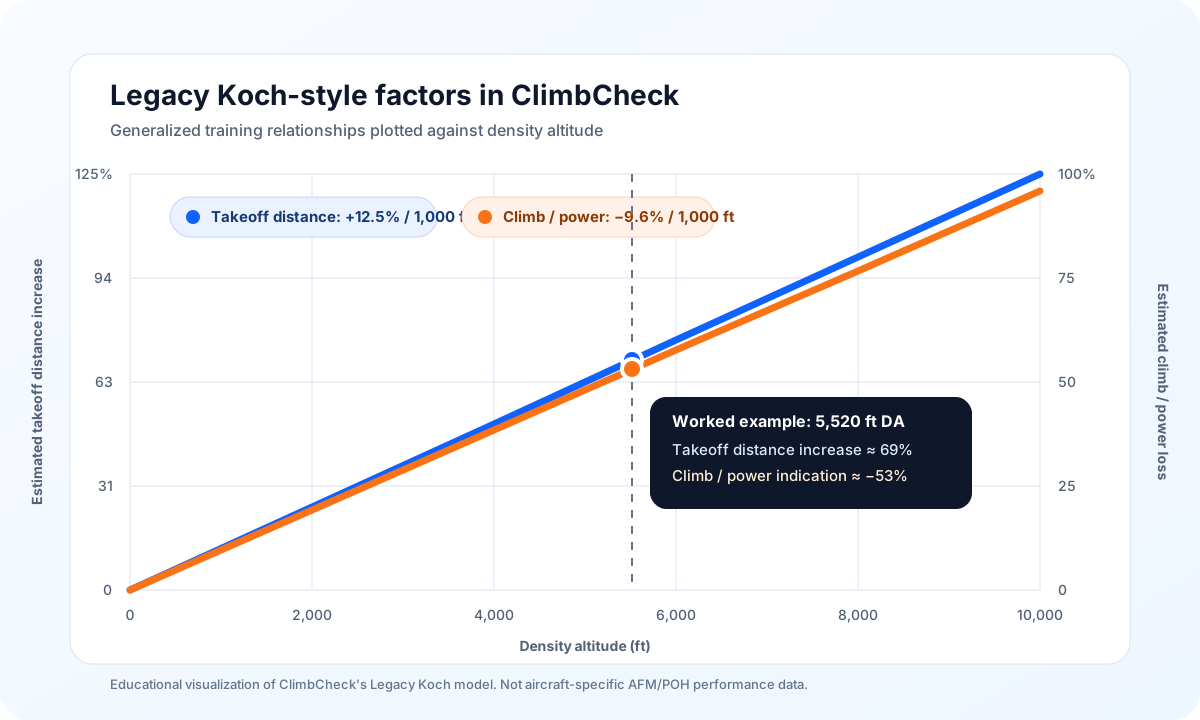
The Legacy Koch model first uses a temperature-based density-altitude estimate, then applies two generalized relationships:
Concise worked example
Consider a training scenario with a pressure altitude of 3,000 ft, an outside-air temperature of 30 °C, a 1,200 ft baseline takeoff distance, and a 4,000 ft runway.
- Estimate ISA temperature. At 3,000 ft, ISA temperature is approximately 9 °C.
- Estimate density altitude. 3,000 + 120 × (30 − 9) gives approximately 5,520 ft.
- Apply the Legacy Koch takeoff factor. 5.52 × 12.5% gives approximately a 69% increase.
- Adjust the baseline. A 1,200 ft baseline becomes approximately 2,028 ft.
- Compare with runway length. The arithmetic remainder is approximately 1,972 ft, but that number is not an operational safety margin by itself.
The corresponding Legacy Koch climb/power indication is approximately −53%. That result is deliberately attention-getting: it is a prompt to consult the aircraft AFM/POH and use conservative operational judgment.
Use the interactive version
The calculator opens with Precise selected because that model uses pressure altitude, temperature, and dew point to estimate air density. It can fetch a current METAR, accept pasted METAR text, or work entirely from manually entered values. Legacy Koch remains available in the model selector for a direct comparison with the historical chart.
How Legacy Koch differs from the other ClimbCheck models
| Model | Atmospheric approach | Best use |
|---|---|---|
| Legacy Koch | Temperature-based density-altitude approximation with classic Koch-style percentage factors | Historical comparison, training, and quick awareness |
| Precise | Uses pressure altitude, temperature, and dew point to estimate air density | More complete atmospheric comparison inside ClimbCheck |
| Rule of thumb | Uses pressure altitude and temperature difference from ISA | Fast mental-model and scenario check |